Make common tasks more direct
Reduce deep menu paths and unnecessary clicks. Put a useful overview at the start of the experience so people can orient themselves before navigating into a specific service or report.
Enterprise dashboard · Internal tools · PT Telkom Indonesia Tbk. · 2024
A clearer route from scattered enterprise data to the insights teams need.
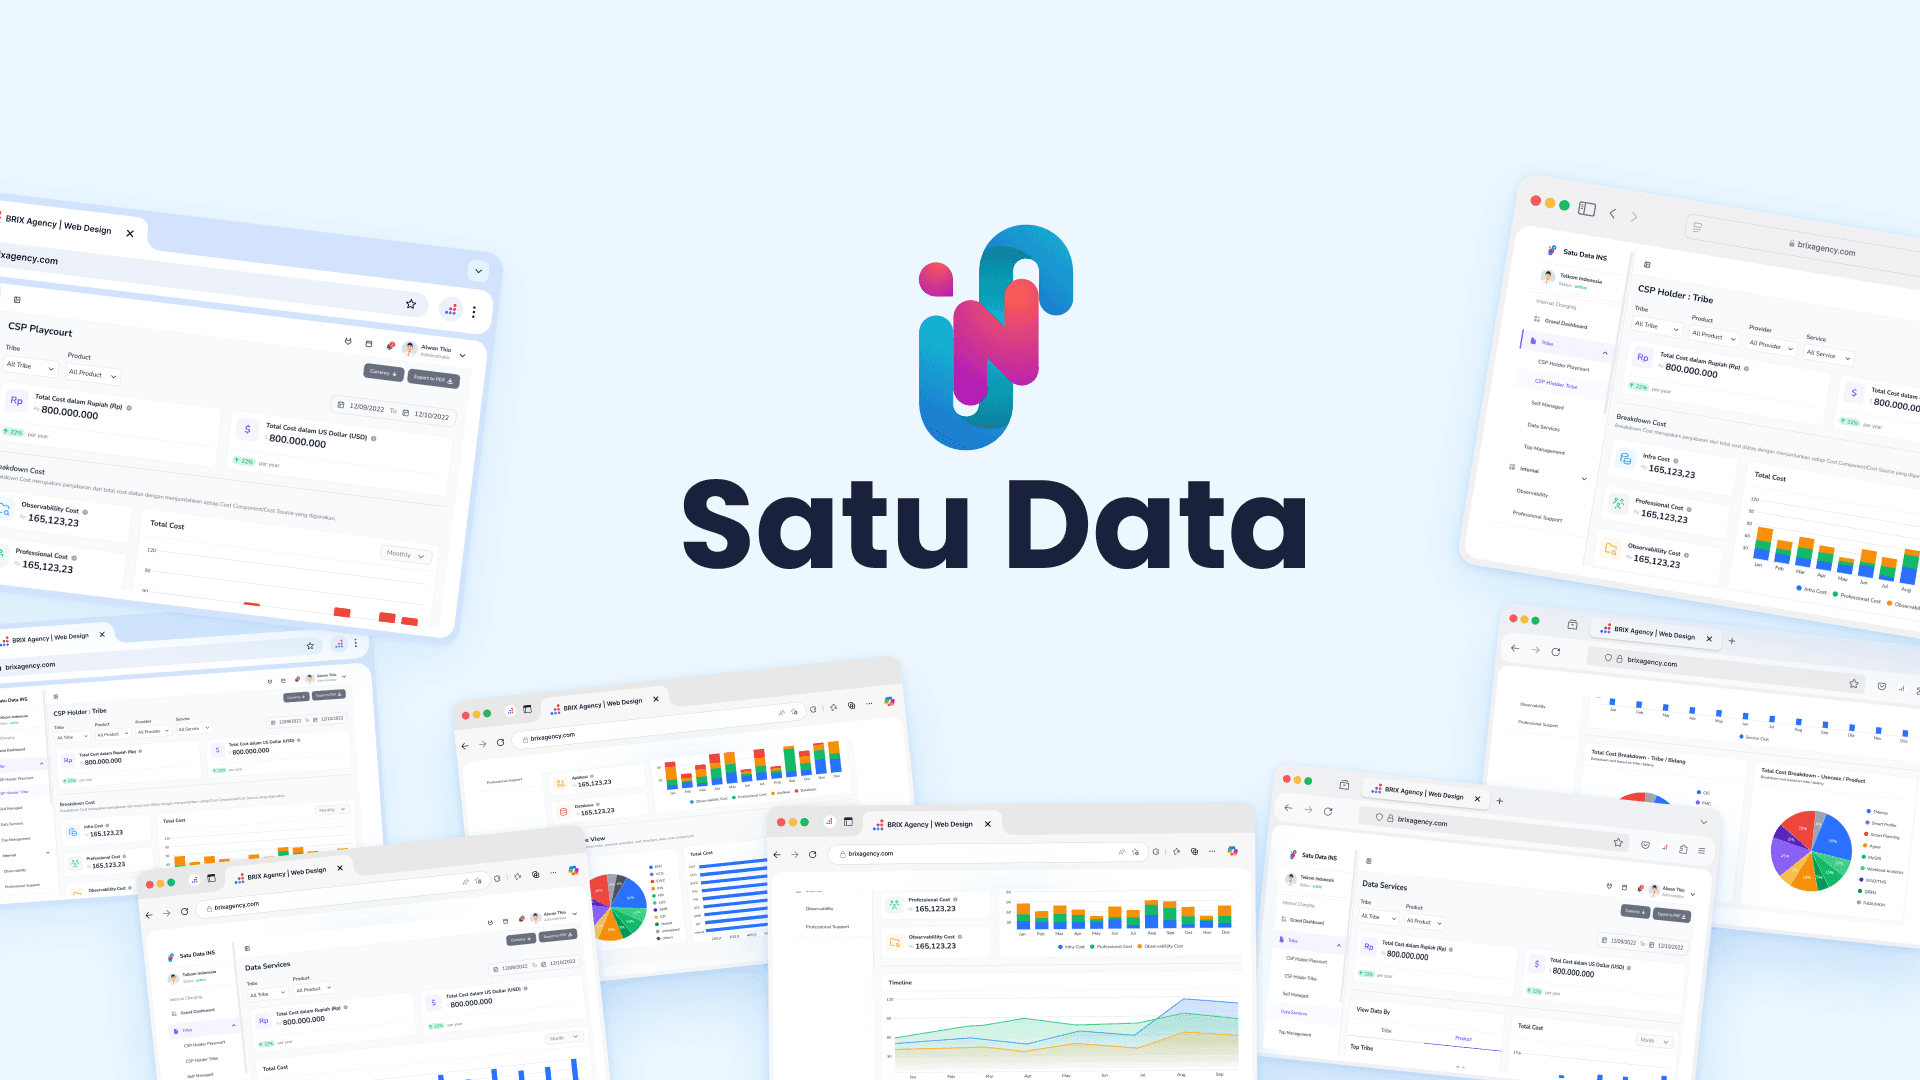
Satu Data is an internal data management platform for a mid-size enterprise. The project began with an assumption that people understood the system but needed to work faster. Research pointed to a different issue: the information architecture made important data hard to find.
Common reporting work could mean moving through several layers of navigation, then piecing information together from separate areas. The amount of data was only part of the challenge; the route to it and the way it was presented made routine work feel heavier.
Research insight
Users were not failing to use the system; they were failing to navigate it.The friction came from the disconnect between where data lived and where decisions needed to be made.
Define
I translated the research into two priorities for the design direction: reduce the effort required to reach frequently used information and make information easier to scan once users arrived.
Reduce deep menu paths and unnecessary clicks. Put a useful overview at the start of the experience so people can orient themselves before navigating into a specific service or report.
Replace text-heavy presentation with a clearer hierarchy, summary cards, and charts. The goal was to help stakeholders spot the shape of the data without first reading every row.
Design rationale
Put the data people need in one clear starting point, then make every other area easier to reach.
The redesign centered the experience on a dashboard and simplified navigation around users’ reporting tasks. This addressed the structural cause of the friction instead of asking people to learn a more complicated menu or remember where each dataset lived.
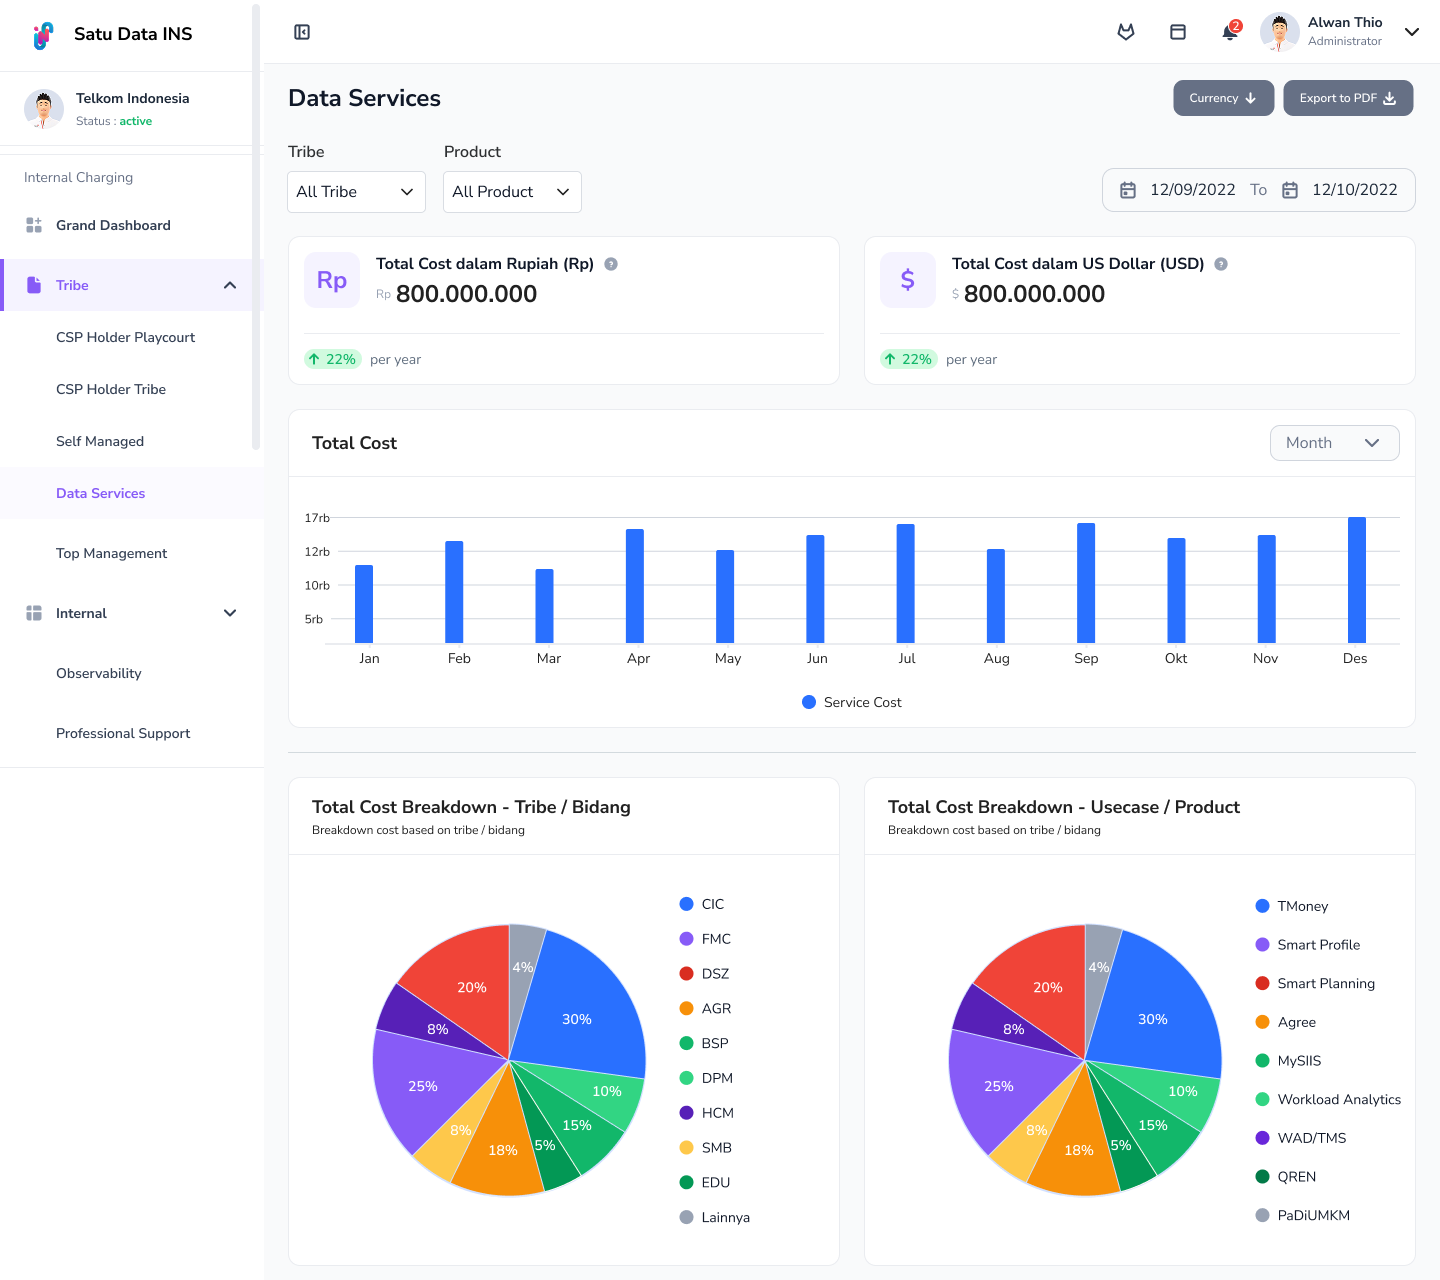
The dashboard concept brings high-level information forward, while the sidebar provides a more direct route into specific areas. Together, these changes create a clearer starting point and a more predictable way to move through the platform.
Ideate
Three connected changes shaped the proposed experience. Each one responds to a research finding: navigation depth, scattered information, or the effort needed to interpret dense data.
The proposed sidebar collapses the structure from four levels to two. In the prototype, core functions are reachable within two clicks instead of paths that could take six or more.
This gives the navigation a more direct relationship to the work and reduces the need to repeatedly open and close nested menus.
The entry screen brings key indicators, recent entries, and quick-access shortcuts together instead of sending people to separate destinations to assemble a high-level view.
From there, users can move into a service or breakdown when they need more detail.
Summary cards and annotated charts give totals, trends, and breakdowns clearer visual priority than dense text-heavy tables.
Whitespace and grouping help users scan the overview first, then focus on the area that needs attention.
Prototype
I started by understanding the stakeholders’ working environment and mapping their day-to-day data workflows. This helped separate navigation problems from the assumption that users simply needed more familiarity with the system.
After identifying the points where information was siloed or hard to scan, I explored a flatter information architecture and a centralized dashboard. I used Figma for ideation and low-fidelity prototyping, then reviewed the direction with the development team to keep the proposal grounded in technical feasibility.
Observe stakeholder work and map how people reach reports and service data. Note where they switch sections or repeat navigation steps.
Frame the problem around information architecture and scannability. Set the direction to shorten common paths and make key data visible sooner.
Explore a shallower sidebar and a dashboard that brings key indicators, recent entries, and shortcuts together.
Develop the concepts in Figma and review them with developers for feasibility before treating them as a proposed direction.
Design output
The completed Figma proposal brings the redesigned data service and infrastructure cost views into one clearer, more scannable experience.
Outcome
The project produced a Figma prototype and a proposed information architecture, reviewed with the development team for technical feasibility. The prototype brings key data into a dashboard, simplifies the route to core functions, and presents cost summaries and trends in a more structured way.
The project outcome is the design proposal itself. I do not have post-launch evidence for adoption, task completion time, or operational impact, so the navigation changes described here refer to the prototype rather than measured production results.